Sourcing guide
How to Cut Empty Return Costs in Plastic Pallet Programs: A Practical Logistics Playbook
A practical framework for reducing empty-return freight, dwell time, and loss in plastic pallet programs across suppliers, warehouses, and distributors.
Plastic pallets often deliver clear benefits in hygiene, consistency, and service life. But many B2B teams discover a hidden cost after rollout: empty return logistics.
When empty pallets move back from distributors, contract packers, or regional warehouses to a central site, the freight cost per usable cycle can rise faster than expected. Trucks leave half full, return lanes are unstable, and some pallets sit too long at downstream nodes.
The operational question is simple:
How can you reduce empty return cost without disrupting outbound service or creating pallet shortages?
This playbook focuses on execution: lane design, trigger rules, load planning, and control metrics that procurement and logistics teams can run together.
1) Map where empty miles are created
Most return programs underperform for one reason: teams track pallet purchases, but not pallet movement behavior.
Start with a lane-level map for the last 8 to 12 weeks:
- shipping origin and return destination,
- average outbound pallets per shipment,
- average empty pallets available for pickup,
- days pallets remain at each node,
- truck utilization on return runs,
- ad-hoc pickups versus scheduled pickups.
This baseline shows where cost is being generated:
- low-density pickup points,
- long dwell time before return quantity reaches economic volume,
- return routes that do not align with outbound routes,
- urgent one-off recoveries caused by local pallet shortages.
If you are still defining pallet quantity assumptions, this plastic pallet pool sizing method can help establish a realistic starting pool before optimizing return lanes.
2) Segment return lanes by volume and stability
Treating all return points the same usually increases freight waste. A better approach is to split nodes into three lane classes.
A-lanes: high volume, stable rhythm
Typical profile:
- predictable weekly empty volume,
- short dwell time,
- consistent transport windows.
Execution model:
- fixed pickup schedule,
- pre-assigned backhaul slots,
- target truck fill rate set by lane.
B-lanes: medium volume, variable rhythm
Typical profile:
- reasonable monthly volume,
- periodic swings by season or promotion,
- occasional urgent depletion.
Execution model:
- trigger-based pickups (for example by pallet count or dwell days),
- shared routes with nearby nodes,
- weekly planner review.
C-lanes: low volume, irregular rhythm
Typical profile:
- small and inconsistent empty volume,
- long distance to central return point,
- high cost per pickup.
Execution model:
- consolidate through regional cross-dock,
- longer pickup windows,
- strict minimum quantity before dispatch unless service risk is high.
This segmentation prevents high-frequency collection from low-volume points while protecting service reliability on critical lanes.
3) Use dual triggers: quantity and time
Single-trigger systems fail in two ways:
- quantity-only triggers can delay returns too long,
- time-only triggers can dispatch half-empty trucks.
Use both:
- Quantity trigger: pickup starts when node inventory reaches a defined pallet count.
- Time trigger: pickup starts if pallets exceed a defined dwell limit, even if quantity is below target.
Example logic:
- A-lane: 120 pallets or 5 days,
- B-lane: 180 pallets or 10 days,
- C-lane: 250 pallets or 18 days.
The exact numbers should match lane economics, storage constraints, and shortage risk. The key is to avoid both extremes: idle stock at customer sites and expensive under-filled returns.
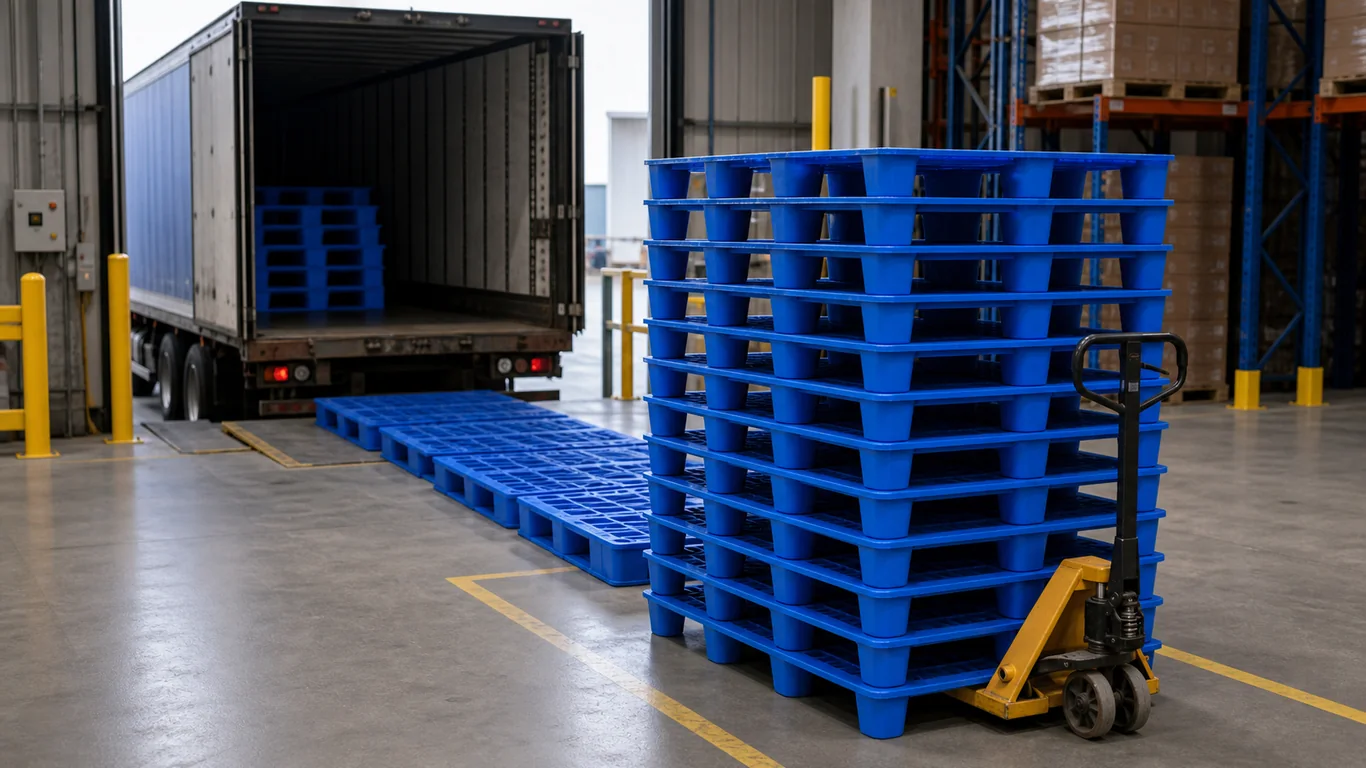
4) Standardize load plans for empty pallet transport
Empty returns are often handled informally, which creates loading inconsistency and safety risk. Standard load plans improve both cost and damage control.
Define a lane-specific loading standard:
- max stack height by pallet model,
- allowed mixed-stack rules,
- strapping or wrapping requirement,
- trailer floor layout,
- photo confirmation at dispatch.
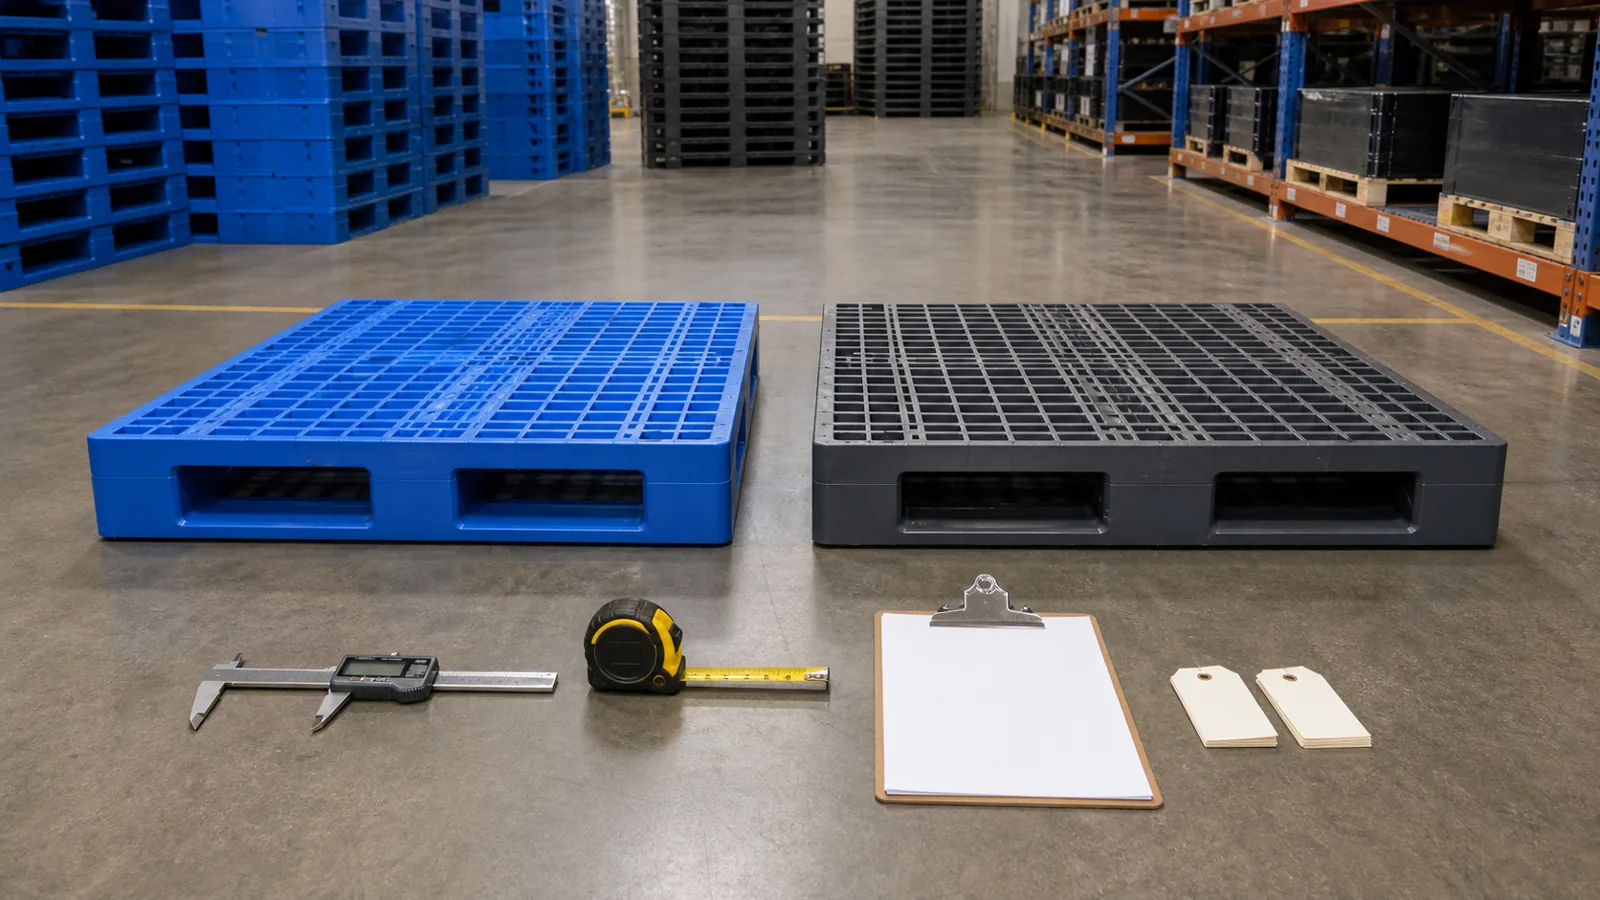
For teams using different pallet structures, never assume identical return performance across models. Nestable and rackable designs behave differently in stack density and transport stability. This comparison of nestable vs rackable plastic pallets is useful when setting lane-specific transport rules.
If your return lane carries reinforced rack pallets, confirm whether the selected model aligns with your transport and handling pattern, such as this 3-runner plastic pallet .
5) Add handover discipline at each transfer point
Many return losses are not theft or breakage. They are record errors during handover.
At every transfer point, record:
- pallet model,
- handover quantity,
- condition class,
- location code,
- date and responsible party.
Keep the process lightweight, but mandatory. A basic scan-and-sign workflow is usually enough to reduce unexplained balance gaps.
For larger networks, build the same location and ID logic used in this plastic pallet traceability labeling system so return data can be compared across sites.
6) Align return policy with Incoterms and transport responsibility
Return friction often starts in contracts, not in warehouses. If transport responsibility is unclear, each party optimizes its own cost and total cycle efficiency declines.
Review whether return ownership is explicit in your commercial terms:
- who arranges return freight,
- who pays when minimum quantity is not reached,
- acceptable dwell window at consignee,
- condition standard for return acceptance,
- dispute process for shortages and damage.
When teams are aligning contract language, use the current ICC Incoterms guidance as a reference framework for delivery and risk transfer definitions (International Chamber of Commerce ). Incoterms do not replace internal SOPs, but they help remove ambiguity between trading partners.
7) Track five KPIs that actually change decisions
Avoid dashboards with too many indicators. For empty return control, five KPIs are usually enough:
- Return freight cost per pallet cycle (total return freight / returned pallet count)
- Average dwell days at downstream nodes
- Truck fill rate on return movements
- Recovery lead time (from pickup trigger to pallet receipt)
- Unexplained pallet balance variance
Review these KPIs by lane class (A/B/C), not only at network total level. Total averages can hide a few expensive lanes that consume most of the budget.
8) Build a monthly correction loop, not one-time optimization
Return networks drift over time due to customer mix, seasonality, and route changes. A one-time redesign will lose effectiveness.
Run a monthly correction cycle:
- update lane classification,
- adjust quantity/time triggers,
- merge or split pickup routes,
- remove emergency recovery patterns by fixing root causes,
- update target pool level if cycle time changes.
If repeated shortages still force urgent returns, revisit the original pool and replenishment logic rather than only tightening transport control.
Final takeaway
Empty return logistics is where many plastic pallet programs win or lose financially. The lowest total cost rarely comes from the cheapest single pickup. It comes from repeatable lane rules: segmented routes, dual pickup triggers, standard load plans, clear handovers, and contract-aligned responsibility.
When procurement, warehouse, and transport teams manage returns as a designed system, pallet cycle cost becomes predictable, shortage risk falls, and the pallet program remains scalable as volume grows.