Sourcing guide
How to Size a Plastic Pallet Pool: A Practical Method for Warehouse and Logistics Teams
Learn a step-by-step method to calculate plastic pallet pool size, safety stock, and lane-level buffers for B2B warehouse and transport operations.
Many companies replace wood pallets with plastic pallets and then face a new operational question: how many pallets should we actually own to keep service stable without tying up too much capital?
Too few pallets create shipping delays, line stoppages, and emergency freight for empty returns. Too many pallets increase idle inventory, storage pressure, and cash lock-up.
This guide gives a practical method for B2B teams to size a plastic pallet pool with enough resilience for real operations.
The planning mistake that causes most pallet shortages
In many projects, teams only calculate pallets from “daily outbound shipments.” That misses the full circulation cycle.
A plastic pallet pool should be sized around cycle time, not just shipment volume. One pallet may leave your site today, but it can take days or weeks to return and become available again.
If cycle time is underestimated, shortage risk is almost guaranteed during peak weeks.
Step 1: Map the full pallet cycle by lane
Break your network into lanes with similar behavior:
- Factory to domestic DC
- Factory to distributor
- Export one-way lanes
- Closed-loop retail replenishment lanes
For each lane, track four time blocks:
- Loading and dispatch waiting time
- Transit and receiving time
- Dwell time at customer site
- Empty return and re-entry time
Add them to get total cycle days.
A lane with 7-day average cycle and a lane with 21-day average cycle should never share the same planning assumptions.
Step 2: Calculate base pool demand
Use this base formula per lane:
Base pallets = Average daily pallet demand × Average cycle days
Example:
- Average demand: 420 pallets/day
- Average cycle: 12 days
Base pallets = 420 × 12 = 5,040 pallets
This is the operational minimum before adding risk protection.
Step 3: Add a realistic safety buffer
Daily demand and return time both fluctuate. Add a safety layer to avoid avoidable stockouts.
A practical method:
Safety pallets = (Peak daily demand − Average daily demand) × Risk coverage days
If your average demand is 420 pallets/day, peak is 560 pallets/day, and you want 4 days of protection:
Safety pallets = (560 − 420) × 4 = 560 pallets
Then:
Target pool = Base pallets + Safety pallets
In this example: 5,040 + 560 = 5,600 pallets
Step 4: Separate structural stock from loss stock
Not all “missing pallets” are operational fluctuation. Some are gradual losses:
- Damage beyond repair
- Misrouting between partners
- Slow recovery from external yards
- Unreported write-offs at nodes
Plan a separate annual factor for this, often as a percentage of circulating pool. Treat it as loss replacement planning, not normal safety stock.
This distinction improves procurement timing and avoids overreacting to short-term variation.
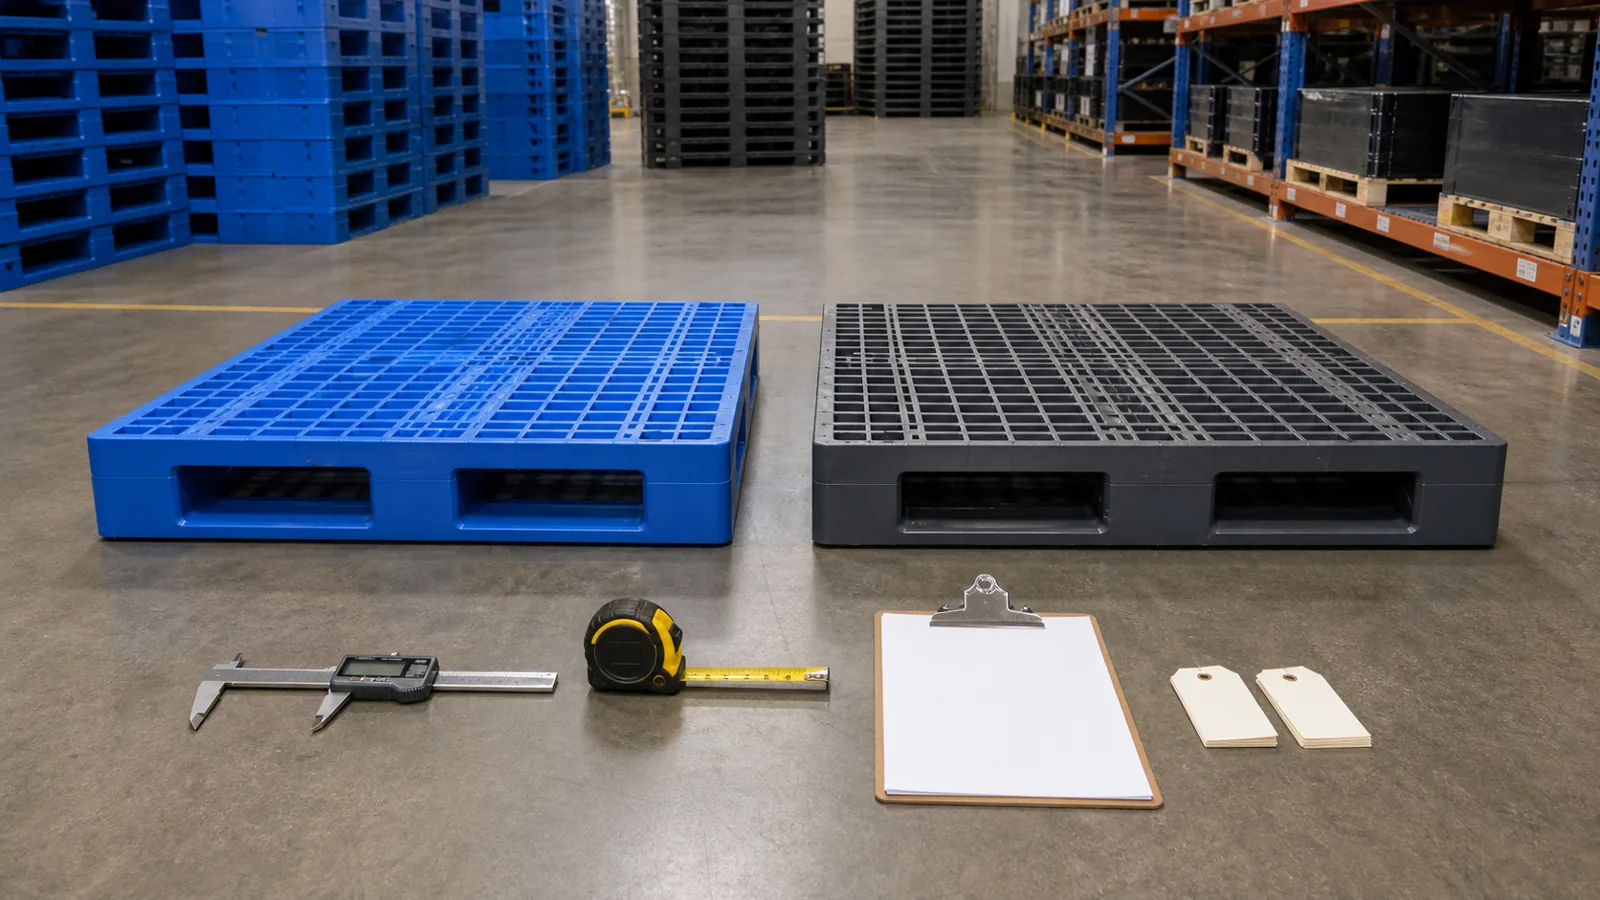
Step 5: Validate by pallet type and use condition
Pool sizing is not only quantity. It also depends on whether the selected pallet type can sustain your handling profile.
If one lane has frequent beam-rack storage or higher point loads, verify structural fit first, then lock quantity planning. A quantity model built on the wrong pallet architecture will still fail in operation.
Use lane-specific technical checks before scaling procurement, especially when mixing nestable and rackable configurations. Related framework: Nestable vs Rackable Plastic Pallets .
Step 6: Build a tiered replenishment trigger
Instead of one reorder point, use three control zones:
- Green zone: normal circulation, no action
- Amber zone: accelerate empty returns, tighten dispatch discipline
- Red zone: release emergency replenishment PO or transfer from backup site
This turns pool control into an operating routine, not a monthly surprise.
KPIs that make pallet pool sizing measurable
Track these indicators weekly:
- Pallet availability rate at dispatch
- Cycle time by lane (average and 90th percentile)
- Empty return turnaround days
- Damage and retirement rate
- Emergency freight events caused by pallet shortage
If cycle time drifts up while demand is stable, the problem is usually recovery discipline, not purchasing price.
Where standards and testing fit into sizing decisions
When pool size is large, technical failure rates can quickly become a planning issue. If the pallet spec is under-designed, damage rates rise and effective pool size shrinks.
Use recognized test frameworks such as ISO 8611 when setting mechanical performance expectations with suppliers (ISO 8611 standard page ). For dimensions and interoperability references, ISO 6780 remains a useful baseline for pallet sizes in global systems (ISO 6780 standard page ).
For first-time migration teams, this implementation sequence helps reduce ramp-up risk: Plastic Pallet Pilot Program and Plastic Pallet RFQ Checklist .
If you are evaluating platform options for closed-loop operations, you can compare different pallet structures in the plastic pallet product catalog .
A 30-day rollout plan for operations teams
- Collect 8–12 weeks of shipment and return data by lane.
- Calculate base pool and safety pool per lane.
- Segment by pallet type requirement (nestable, rackable, reinforced).
- Define green/amber/red trigger thresholds.
- Start weekly KPI review and adjust assumptions every month.
Most teams can move from rough estimates to a stable control model within one planning cycle.
Final takeaway
A reliable plastic pallet pool is designed, not guessed.
When you size by lane-level cycle time, add a demand-based safety buffer, and separate loss replacement from normal stock, you get a pool that supports service reliability without excessive overbuying.
For B2B warehouse and logistics leaders, this is one of the highest-leverage steps in pallet standardization.